

How to Calculate a Bond Yield Curve means plotting yields by maturity so the shape of interest rates becomes visible. A yield curve can slope upward, flatten, invert, or bend in the middle, and each shape says something about market pricing, not a guaranteed forecast.
This is general finance education, not investment advice. Bond prices, yields, credit risk, taxes, liquidity, and reinvestment assumptions can change quickly. Use official data and a qualified adviser for real portfolio decisions.
Choose One Bond Family
Do not mix unrelated bonds and call it a yield curve. Start with one issuer type and similar credit quality, such as U.S. Treasury par yields, municipal AAA curves, or one corporate issuer's bonds.
The U.S. Treasury publishes daily Treasury par yield curve rates, which are commonly used as a benchmark.
Collect Maturities
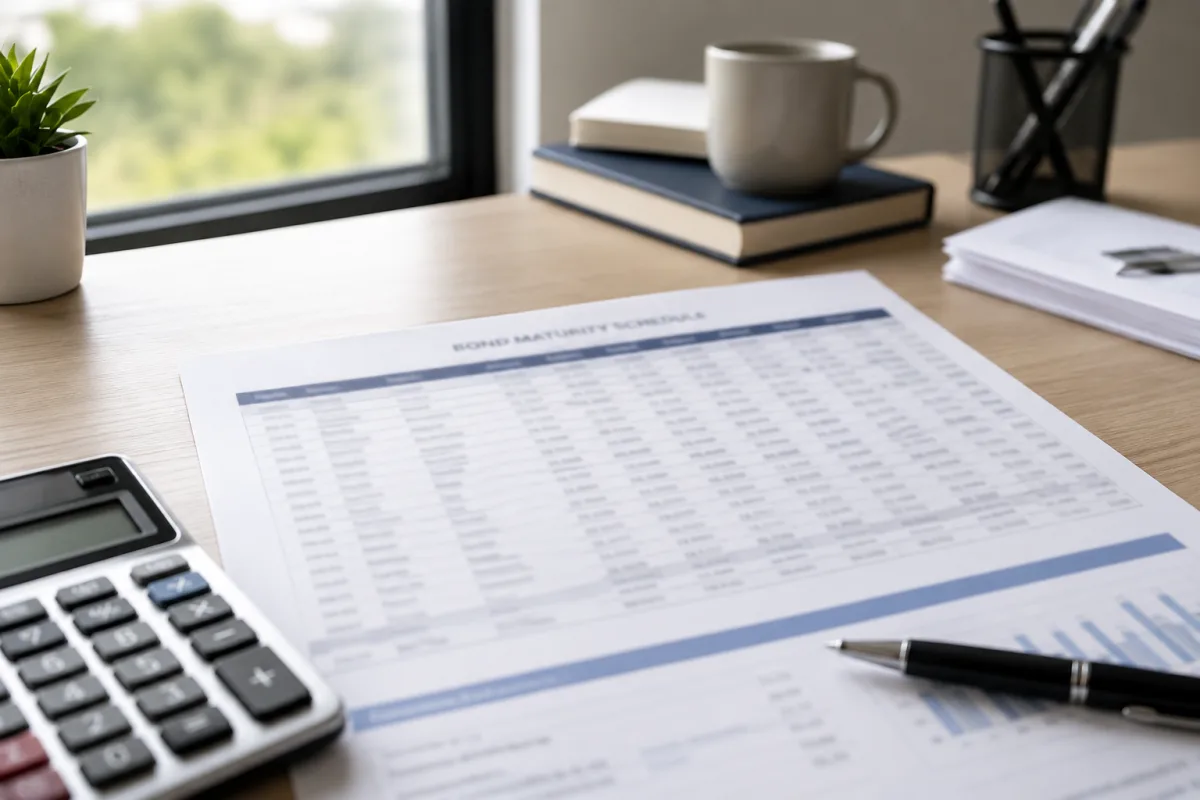
A basic curve needs several maturity points: short, intermediate, and long. Treasury data often includes 1-month through 30-year points. Corporate or municipal curves may have fewer clean points.
Write maturities in years or months consistently. A messy x-axis makes the curve misleading.
Use Comparable Yields
Use the same yield type for each point. Do not mix coupon rate, current yield, yield to maturity, and yield to call. A clean curve uses comparable market yields across maturities.
For related bond math, Livecub's financial calculator bond guide can help with yield inputs.
Plot The Curve

Place maturity on the horizontal axis and yield on the vertical axis. Each bond or Treasury point becomes one dot. Connect the dots only if the points are comparable enough to tell a useful story.
A curve is a visual aid, not proof that future rates will follow the line.
Read The Shape
An upward curve usually means longer maturities yield more than shorter maturities. A flat curve shows smaller differences. An inverted curve means shorter maturities yield more than longer maturities.
Treasury's methodology page explains that its official curve is a par yield curve derived from market quotations. See Treasury yield curve methodology.
Do Not Ignore Credit
A high-yield corporate curve and a Treasury curve may differ because of default risk, liquidity, tax treatment, and market stress. The spread between curves can be as important as the curve itself.
Livecub's U.S. Treasury bond buyer guide is useful for issuer context.
Coupon And Price
A bond's coupon is not the same as its yield. Premium and discount pricing can move yield away from the stated interest rate. That is why yield-curve work should use market yield, not face coupon alone.
For premium purchase context, Livecub's premium bond purchase guide is related.
Smoothing
Professional curves may use models to smooth missing points. A household worksheet does not need advanced fitting, but it should avoid pretending a thin dataset is precise.
If you only have three maturities, call it a rough comparison rather than a full curve.
Treasury Bills
Short Treasury bills are quoted differently from coupon bonds, so be careful when mixing bill rates with par yields. Treasury publishes separate bill rate data and par yield data.
Use one official series for one chart when possible.
Date Matters
Yield curves change daily. A curve from last month may not describe today's market. Always label the date and source before using the chart for decisions.
This is especially important around Federal Reserve meetings, inflation reports, and market stress.
Compare Curves
Comparing today's curve with a prior date can show whether short rates, long rates, or the whole curve moved. That is often more useful than staring at one day's shape.
Use the same source and same maturity points for both dates.
Portfolio Use
A yield curve can help frame duration, laddering, reinvestment risk, and income expectations. It cannot tell you which bond is automatically best.
For small Treasury purchases, Livecub's $100 Treasury bond guide may help with practical access.
Spreadsheet Steps

Create columns for date, issuer, maturity, yield, source, and notes. Sort by maturity, then plot a line chart. Keep raw data below the chart so you can audit mistakes later.
Common Errors
Common errors include mixing dated sources, using coupon instead of yield, omitting call features, comparing tax-free and taxable yields directly, and forgetting that thinly traded bonds may have stale prices.
Bootstrapping Versus Simple Plotting
Professional fixed-income desks may bootstrap spot curves from coupon securities. A household investor usually does not need that level of modeling. A simple plotted par-yield curve can still teach the shape of rates.
The key is naming what you built. Do not call a simple line chart a spot curve or forward curve unless you actually calculated those rates.
Spreads Over Treasuries
Corporate and municipal investors often compare yields to a Treasury curve. The difference is the spread, which may reflect credit risk, liquidity, tax treatment, call risk, or market stress.
A widening spread can matter even when the Treasury curve itself is stable. That is why curve work often becomes curve-plus-spread work.
Callable Bonds
Callable bonds can distort a curve because the stated maturity may not be the date investors actually experience. If the bond is likely to be called, yield to call may be more relevant than yield to maturity.
Label callable issues in your sheet. A smooth curve built from callable and noncallable bonds may hide the real risk.
Taxable Versus Tax-Exempt
Municipal curves are often tax-exempt, while Treasury and corporate curves are taxable. Comparing raw yields can mislead investors in different tax brackets.
Use taxable-equivalent yield when comparing after-tax income, but remember state taxes and alternative minimum tax may affect the answer.
What The Curve Cannot Tell You
A yield curve does not guarantee total return. If rates move, a bond may gain or lose market value. If credit deteriorates, yield may rise for a bad reason. If you sell early, the curve you used may no longer apply.
Treat the curve as a map of today's prices, not a promise about tomorrow.
Interpolation
If you need a 7-year estimate but only have 5-year and 10-year points, you may interpolate. That means estimating between known points. It is useful for rough work, but it is still an estimate.
Do not hide interpolation. Mark estimated points differently from observed points so the chart remains honest.
Forward Rates
Forward rates are implied future rates derived from today's curve. They are not predictions in the ordinary sense. They reflect current market pricing and assumptions.
A beginner worksheet should usually stop at the spot or par curve before attempting forward-rate math.
Ladder Design
Investors sometimes use a curve to choose bond ladder maturities. A steep curve may reward longer maturities, while a flat curve may make shorter maturities more attractive, but risk and goals still matter.
A ladder should also consider cash needs, taxes, call risk, and whether the investor can hold through price changes.
Chart Labels
Label the chart with source, date, yield type, issuer type, and whether yields are taxable or tax-exempt. A chart without labels can be reused later in the wrong context.
Good labels are boring, but they prevent bad decisions.
Recession Signal Caution
People often treat an inverted curve as a recession signal. It can be a warning sign, but it is not a timer. The curve can invert, steepen, and shift before the economy clearly changes.
Use the curve with employment, inflation, credit spreads, earnings, and policy data rather than as a single forecast.
Real World Check
After plotting, compare your curve with a trusted market source. If your curve shape looks wildly different, check dates, yield type, decimals, and whether one bond has a call or credit issue.
Most spreadsheet errors are ordinary input mistakes, not deep market insight.
Frequently Asked Questions
What is a bond yield curve?
It is a chart of yields across different maturities for comparable bonds.
Can I mix corporate and Treasury yields?
Not for one clean curve. Compare them as separate curves or spreads.
What does an inverted curve mean?
Shorter maturities yield more than longer maturities; it can signal market concern but is not a guaranteed forecast.
Which yield should I use?
Use comparable market yields, such as Treasury par yields or yield to maturity for similar bonds.
How often does the curve change?
It can change every trading day as prices and yields move.
The Practical Takeaway
Calculate a bond yield curve by choosing comparable bonds, collecting maturity and yield points, plotting them by date, and reading the shape while respecting credit, liquidity, and data limits.

Patrick Harwood
Edits sports, consumer-finance and general legal explainers. Regulated or time-sensitive topics link to primary sources and are not professional advice.




Leave a reply
Replying to